The Importance of Occupancy Data in Workplace Design
Data and the design of spaces
Designing an adapted workplace that truly meets organizational and employee needs is both an art and a science. Traditionally, workspace design has relied on the experience and intuition of architects and planners. They make educated guesses about how many meeting rooms, desks, or collaboration areas are needed based on headcount and hoped-for usage. However, there is often a reality gap between these assumptions and how the space ends up being used. This is where occupancy data comes into play. By leveraging hard data on space utilization, organizations can bridge the gap between design intent and actual employee behavior, creating work environments that are efficient, flexible, and attractive for staff.
In fact, global studies have found that a significant portion of office space is underutilized on a daily basis – for example, real estate firm JLL reports around 40% of commercial office space is typically empty at any given time. Designing with real occupancy insights can turn this around, ensuring every square foot of an office is justified by usage or experience value. In the age of hybrid work, this has never been more important. Below, we explore how occupancy analytics, like those provided by MySeat, inform better design decisions.
Data-Driven Design: Merging Analytics with Architecture
Occupancy data provides valuable insight into how workspaces are actually used by employees. Instead of guessing, organizations and their designers can understand real usage patterns – which areas are bustling hubs of activity, which sit empty, how often various amenities are used, and so on. Armed with this information, they can tailor the work environment to match employee needs, optimize space utilization, and even reduce costs by eliminating or repurposing underused space.
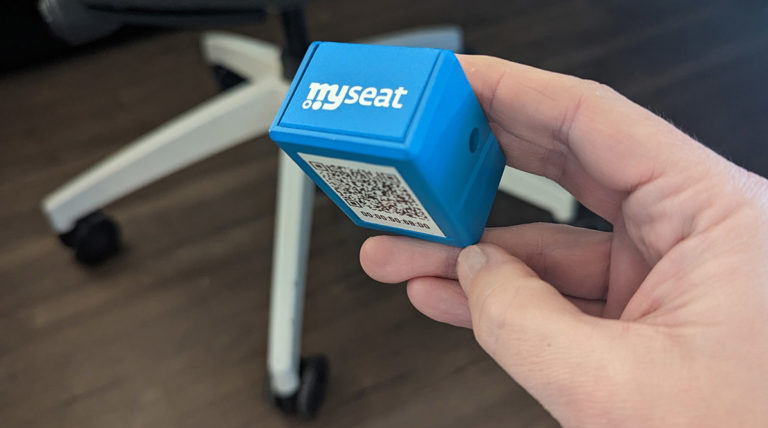
MySeat’s system, for example, measures occupancy with wireless accelerometric sensors attached to furniture and equipment. These tiny devices (about the size of a matchbox) can be discreetly installed on chairs, desks, tables, and in rooms. They detect when an object is in use – for instance, when a chair is sat on or a table is being worked at. Over time, the sensors collect accurate, anonymous data on how each space is utilized. Designers might assume a certain area will be a popular collaboration zone, but the data may show it’s rarely used; conversely, a nook intended as a reception area might become an impromptu team meeting spot. With data, such discrepancies become visible, allowing for evidence-based adjustments in design.
Is It Complicated to Gather This Data?
Not at all. MySeat’s patented occupancy sensor system is designed to be easy to deploy and maintain. The sensors operate wirelessly (no need to tear open walls or run cables) and transmit data to a central server in real time via routers placed in the office. The setup is minimally invasive – you can fit out an office with sensors in chairs and under desks in a matter of hours. Once in place, the system starts logging how each workspace is used: how often a desk is occupied, when conference rooms are filled and for how long, foot traffic patterns in open areas, and more.
The data collected includes key indicators like: location of each resource, the duration of use, peak usage hours, and frequency of use over days or week. MySeat’s team assists clients by organizing this data into intuitive reports, complete with learnings and recommendations. The focus is on making the information digestible and actionable for workplace strategists and designers.
One big advantage of this system is that it’s completely anonymous – it tracks objects, not people. This means there are no privacy concerns about monitoring individuals. You get the big-picture patterns without any personal data. The lack of wiring and the discrete size of sensors means they don’t alter the aesthetic of the space or interfere with daily activities. In essence, it’s a low-friction, high-impact addition to the design process.
What Can We Learn from Occupancy Analytics?
By studying occupancy data, organizations often discover surprising truths about their workplace. Some common insights include:
Actual vs. Assumed Usage: You might learn that certain spaces (like large formal meeting rooms or private offices) are not used as much as anticipated, whereas informal huddle spaces or cafés are in high demand. For example, one company found that their large conference rooms were booked often but, according to sensor data, half those meetings had just 1–2 people in the room. This insight led them to create more small meeting rooms and convert some large rooms into flexible lounges, better matching how employees were collaborating in practice. Occupancy data can challenge long-held assumptions and prevent costly misallocations of space
Peak Times and Utilization Rates: You may identify peak occupancy hours – say, the office is 80% occupied at 11 AM, but drops to 30% after 3 PM. This can influence everything from design (maybe a space doubles as a social area in afternoons when work usage is low) to operations (like staggering janitorial services or reducing lighting/HVAC during off-peak times). It also reveals if you have enough capacity; if certain areas are consistently at 100% utilization at peak, that indicates overcrowding and a need for either more space or better scheduling.
Zonal Differences: Occupancy reports often show that not all parts of an office are equal. Perhaps the marketing team’s area is buzzing, while the sales team’s section sees far fewer people because many are on the road. Designers can use this info to redistribute amenities – for instance, placing extra focus rooms or phone booths near departments that need quiet, or adding collaboration zones where spontaneous interactions often occur. In hybrid work settings, you might find neighborhoods of mostly remote workers have a lot of empty desks, suggesting those could be turned into shared or drop-in workstations rather than assigned seating.
Impact of Hybrid Work: In the context of hybrid working modes, occupancy data is crucial to identify how often employees actually come in versus stay remote. It can show, for example, that on any given day only 50% of desks are occupied because people alternate days. Such data helps right-size the office – maybe a 100-person company finds they only ever see a maximum of 60 people in office at once, meaning they could downsize or reconfigure space for 60 active seats and use the rest of the area for other purposes (training rooms, collaboration studios, etc.). It also helps measure reservation vs. use: in hybrid setups, employees might reserve a desk or room but then not show up, similar to the meeting room no-show issue. Sensors catch that, enabling improvements to the desk booking system or policy.
Ultimately, the goal of analyzing occupancy data is to create a feedback loop for workplace design. Instead of designing the office and hoping for the best, companies can validate their design with real usage metrics and adjust. This is incredibly helpful in today’s fast-changing work culture. As an example, post-pandemic many companies are experimenting with different configurations (more collaborative spaces, fewer fixed desks). The ones leveraging occupancy analytics can quickly tell what’s working and what’s not, then refine their designs accordingly.
Designing for Experience and Efficiency
Attracting employees back to the office (at least some of the time) requires workspaces that offer value beyond what one gets at home. Occupancy data can highlight what draws people in. Maybe the data shows the café and social lounges are consistently used – a sign that people come in for interaction – whereas an over-supply of individual cubicles sits empty because solo work is being done at home. With such insight, a designer might incorporate more hospitality-like elements in the office (comfortable seating areas, coffee bars, informal meeting nooks) to capitalize on what employees enjoy on-site.
From an efficiency standpoint, occupancy analytics ensures that rented real estate is not going to waste. Given the cost of office space, especially in major cities, every underused square foot is a lost opportunity. Data-driven design helps in optimizing the ROI of office space. If a company learns through MySeat’s data that a large portion of their space is rarely used, they can make informed decisions: consolidate floors, sublease unused space, or redesign it to serve a new function (like creating a training center that was previously not feasible due to presumed space constraints).
Crucially, occupancy data provides an objective basis for making tough decisions. Instead of relying on the loudest opinions (“We need more meeting rooms!” or “Our office is always empty on Fridays!”), management and designers can point to the evidence. This leads to more consensus and smarter investment in office improvements.
Conclusion
In the modern workplace, design and data go hand in hand. Occupancy analytics has emerged as a powerful tool to create workplaces that are both responsive to employee behaviors and optimized for cost and efficiency. By continuously collecting and reviewing how space is utilized, organizations create a virtuous cycle: design, measure, learn, adjust – leading to ever better work environments.
MySeat’s wireless sensor solution exemplifies how easy it now is to integrate data into the design process. With real-time, anonymous usage statistics, companies can validate whether their workplaces truly serve their employees. In an era where hybrid work and employee experience are paramount, this approach ensures that the office remains relevant and valuable. Spaces can be reimagined not based on guesswork, but on how people actually vote with their feet (and chairs!).
Ultimately, the importance of occupancy data in workplace design lies in its ability to ground creativity in reality. Architects and designers will always be needed to dream up work environments that inspire and support productivity. Now, they have a feedback mechanism to see if their creations function as intended, and the insight to adapt them when they don’t. The result is an adapted workplace – one that evolves with the organization, driven by the twin guides of human-centered design and hard data on usage. As organizations embrace this blend of art and science, they’ll find their offices becoming places that employees genuinely want to use, and that leaders can confidently invest in because they serve their purpose effectively.