Workplace Utilization Data Compared to Google Mobility Report
This report examines the impact of COVID-19 on office usage by comparing two very different data sources: MySeat’s workplace occupancy data and Google’s Community Mobility Report for workplaces. Our goal was to see how closely the trends in MySeat’s sensor-collected data align with Google’s GPS-based mobility data during the pandemic, focusing on the province of Quebec. If the patterns match, it validates that MySeat’s anonymous, asset-based data can capture broad workplace utilization trends.
The study found that MySeat’s office utilization metrics closely mirror the overall trends observed in Google’s mobility data, with both data sets showing a sharp decline in workplace activity during the early pandemic period. However, there were also key differences – notably, MySeat data showed an even earlier and steeper drop in activity. This is likely because Google’s data includes a wider array of “workplaces” (including essential services) whereas MySeat’s data is specifically from corporate office environments where work-from-home was more universally adopted. Below, we detail the findings and implications.
Data Sources and Methodology
MySeat’s dataset consists of anonymous occupancy readings from multiple office venues in Quebec, collectively serving around 10,000 employees. These readings come from MySeat’s wireless IoT sensors on office furniture and workstations, which report when and how spaces are used. Google’s Community Mobility Reportmyseat.io, on the other hand, uses aggregated, anonymized location data from smartphones to track movement trends across broad categories (one of which is “Workplaces”). For Quebec, Google’s workplace category includes anyone whose phone data indicates they are at a workplace location (offices, factories, stores, etc.).
To compare apples to apples, we aligned both data sets over the same timeframe. We used Google’s definition of a baseline period (January 3 – February 6, 2020) as a reference for normal activity levels before COVID. For each subsequent day, Google reports the percentage change in workplace mobility relative to that baseline. We computed a similar metric for MySeat: the daily percentage of active workstations relative to the pre-COVID baseline, across our client sites.
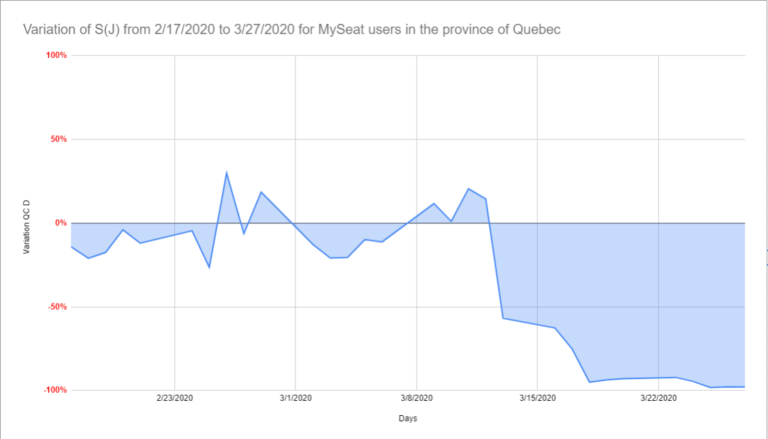
By plotting MySeat’s Occupancy Index against Google’s Workplace Mobility Index over the first 7 weeks of the pandemic (mid-February to end of March 2020), we could directly visualize how the trends compared.
Here in Québec: Early Pandemic Response
In Québec, the provincial government highlighted Google’s mobility data in early April 2020 as proof that people were adhering to confinement measures. During an April 8, 2020 press briefing, Quebec’s premier noted that the Google report showed Quebec leading in social distancing compliancemyseat.io. Naturally, at MySeat we were curious – were our own clients’ office utilization data showing the same thing?
MySeat had been proactively helping clients use their occupancy data from the pandemic’s start. As offices emptied in March 2020, we advised clients to monitor their dashboards to ensure the transition to remote work was happening as expected (and to catch any anomalies, like people coming in when they shouldn’t). This gave companies a real-time pulse on occupancy, helping them verify that work-from-home policies were being followed and, later, to identify when activity started picking back up as restrictions evolved.
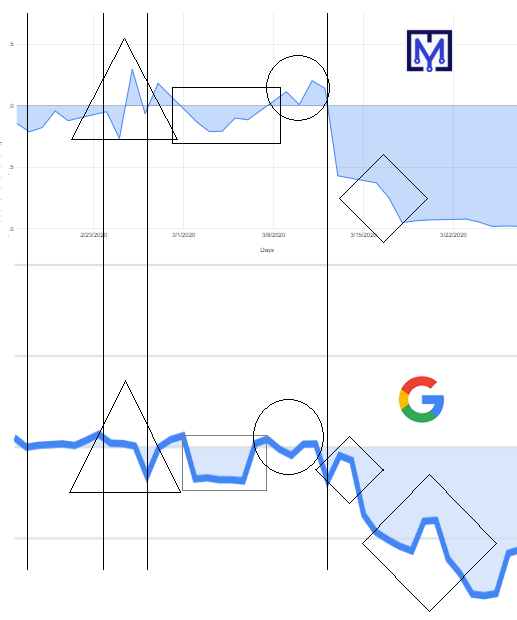
When we overlayed MySeat’s data with Google’s, the similarities were striking. Visually, the two curves – MySeat’s workplace occupancy and Google’s workplace mobility – dipped and rose almost in sync:
Both data sets showed a steep decline in activity in mid-March 2020 as lockdowns took effect.
The “knee points” (sudden inflection points in the curves where activity drops or rises) occurred at nearly the same dates in both datasets, indicating that both MySeat sensors and Google’s location data captured the timing of when people stopped going to workplaces.
Overall patterns week-by-week were closely correlated. When graphed, you can see the same waves in both, with only minor deviations.
These similarities suggest that asset-based occupancy sensing can reflect broader human mobility trends. Despite using completely different technologies (sensors on chairs vs. smartphone GPS), both methods clearly registered the massive shift to remote work.