MySeat Blog
Insights and expertise on workplace analytics, occupancy sensing, and creating smarter, more efficient workspaces.

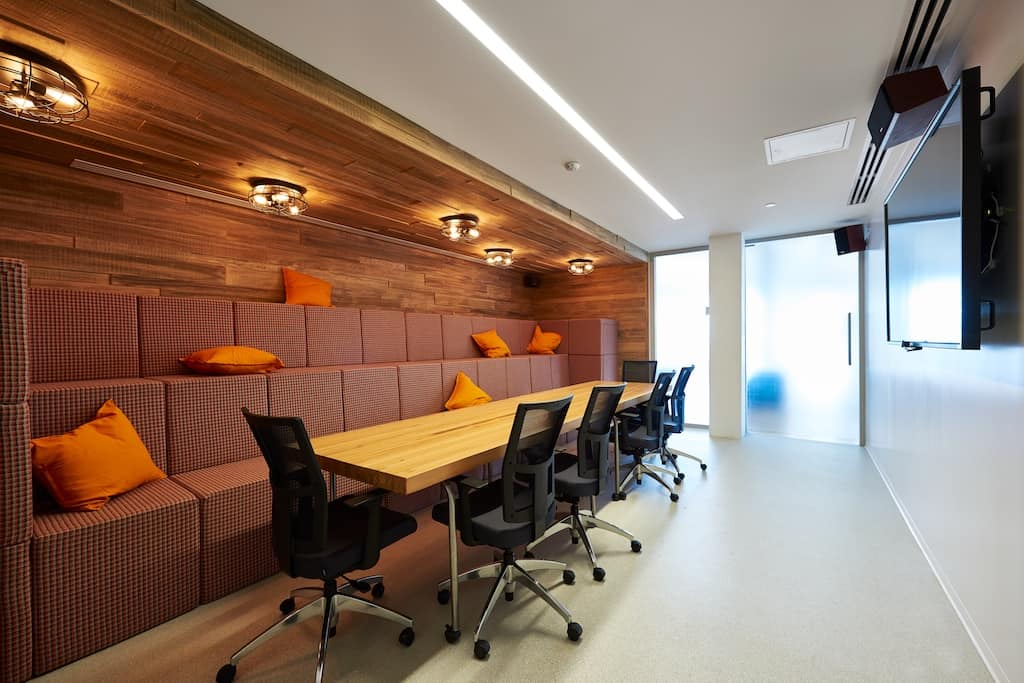
Meeting Room Analytics – How to Measure and Improve Usage
“No available meeting rooms.” It’s a frustrating message we’ve all seen on the booking system – often while we also see plenty of empty rooms around us. Meeting spaces are one of the most common pain points in offices. Either you can’t find a room when you need one, or you discover later that booked ... Meeting Room Analytics – How to Measure and Improve Usage

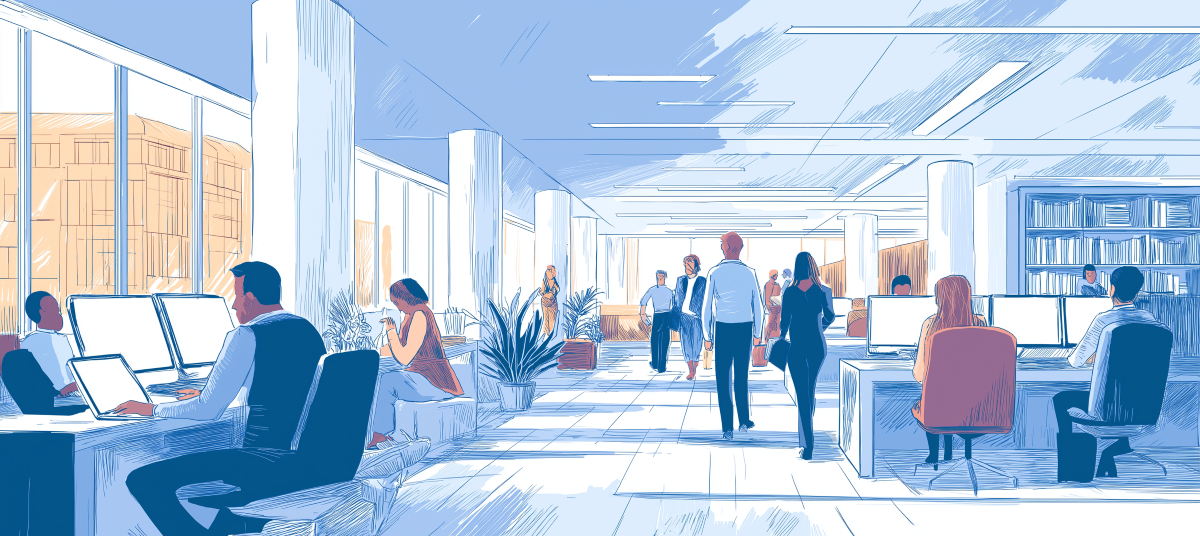
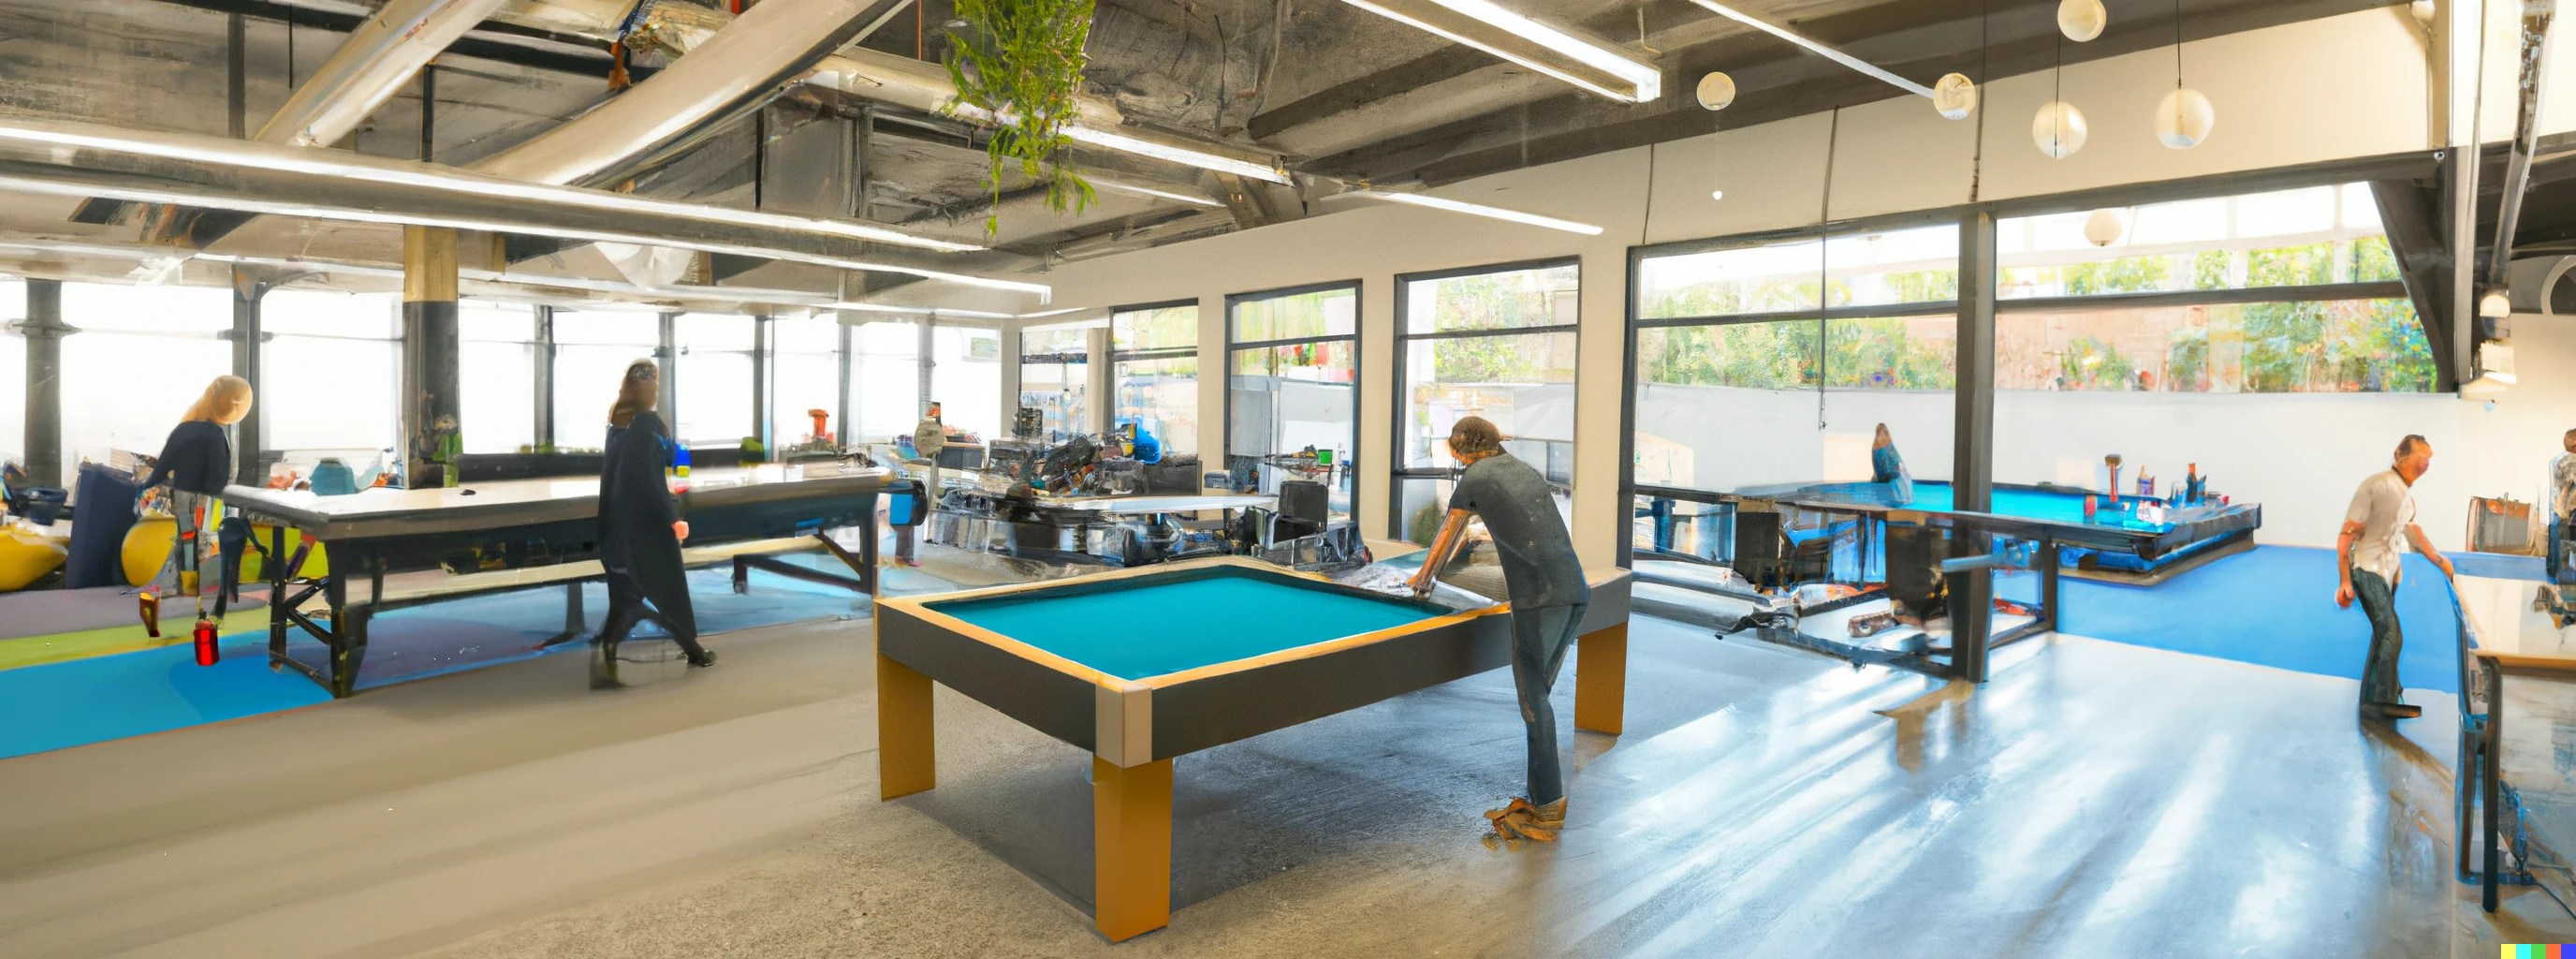
Hybrid Office Design // Balancing Collaboration and Focus
Hybrid Office Design: Balancing Collaboration and Focus in One Workplace Designing an office in the era of hybrid work is a delicate balancing act. On one hand, you need collaborative spaces that draw people in in-person for team work and social connection. On the other, employees still need quiet, focused areas – especially since many ... Hybrid Office Design // Balancing Collaboration and Focus
Hybrid Work Post-Covid // The Return-to-Office Reality 2025
Hybrid Work Post Covid: Office Occupancy Insights and Strategy Despite a steady return to the office since 2020, most workplaces remain strikingly underused. On a typical day, far too many desks are sitting empty. Industry benchmarks from 2023 revealed that average peak utilization in U.S. offices hovered around 27%—meaning that even at the busiest moment ... Hybrid Work Post-Covid // The Return-to-Office Reality 2025
How World-Class Workplace Research Proves the Need for Better Occupancy Data, and How MySeat Can Help
The New Post-Pandemic Workplace Challenges Across the globe, HR and Corporate Real Estate (CRE) leaders face a new set of post-pandemic challenges: How do we make offices relevant again? How do we prove ROI on space investments? How do we ensure employees are supported, engaged and choosing to come in? Many organisations are moving past ... How World-Class Workplace Research Proves the Need for Better Occupancy Data, and How MySeat Can Help
Closing the Gap: How Data Unlocks Smarter Hybrid Workplace Decisions
Corporate Real Estate (CRE) is evolving — but not always in sync with the realities of today’s hybrid workplace. The What Occupiers Want 2025 report confirms a key shift: most organizations have moved past emergency downsizing toward proactive portfolio management. 66% have already reduced their footprints, and for the first time since the pandemic, a ... Closing the Gap: How Data Unlocks Smarter Hybrid Workplace Decisions

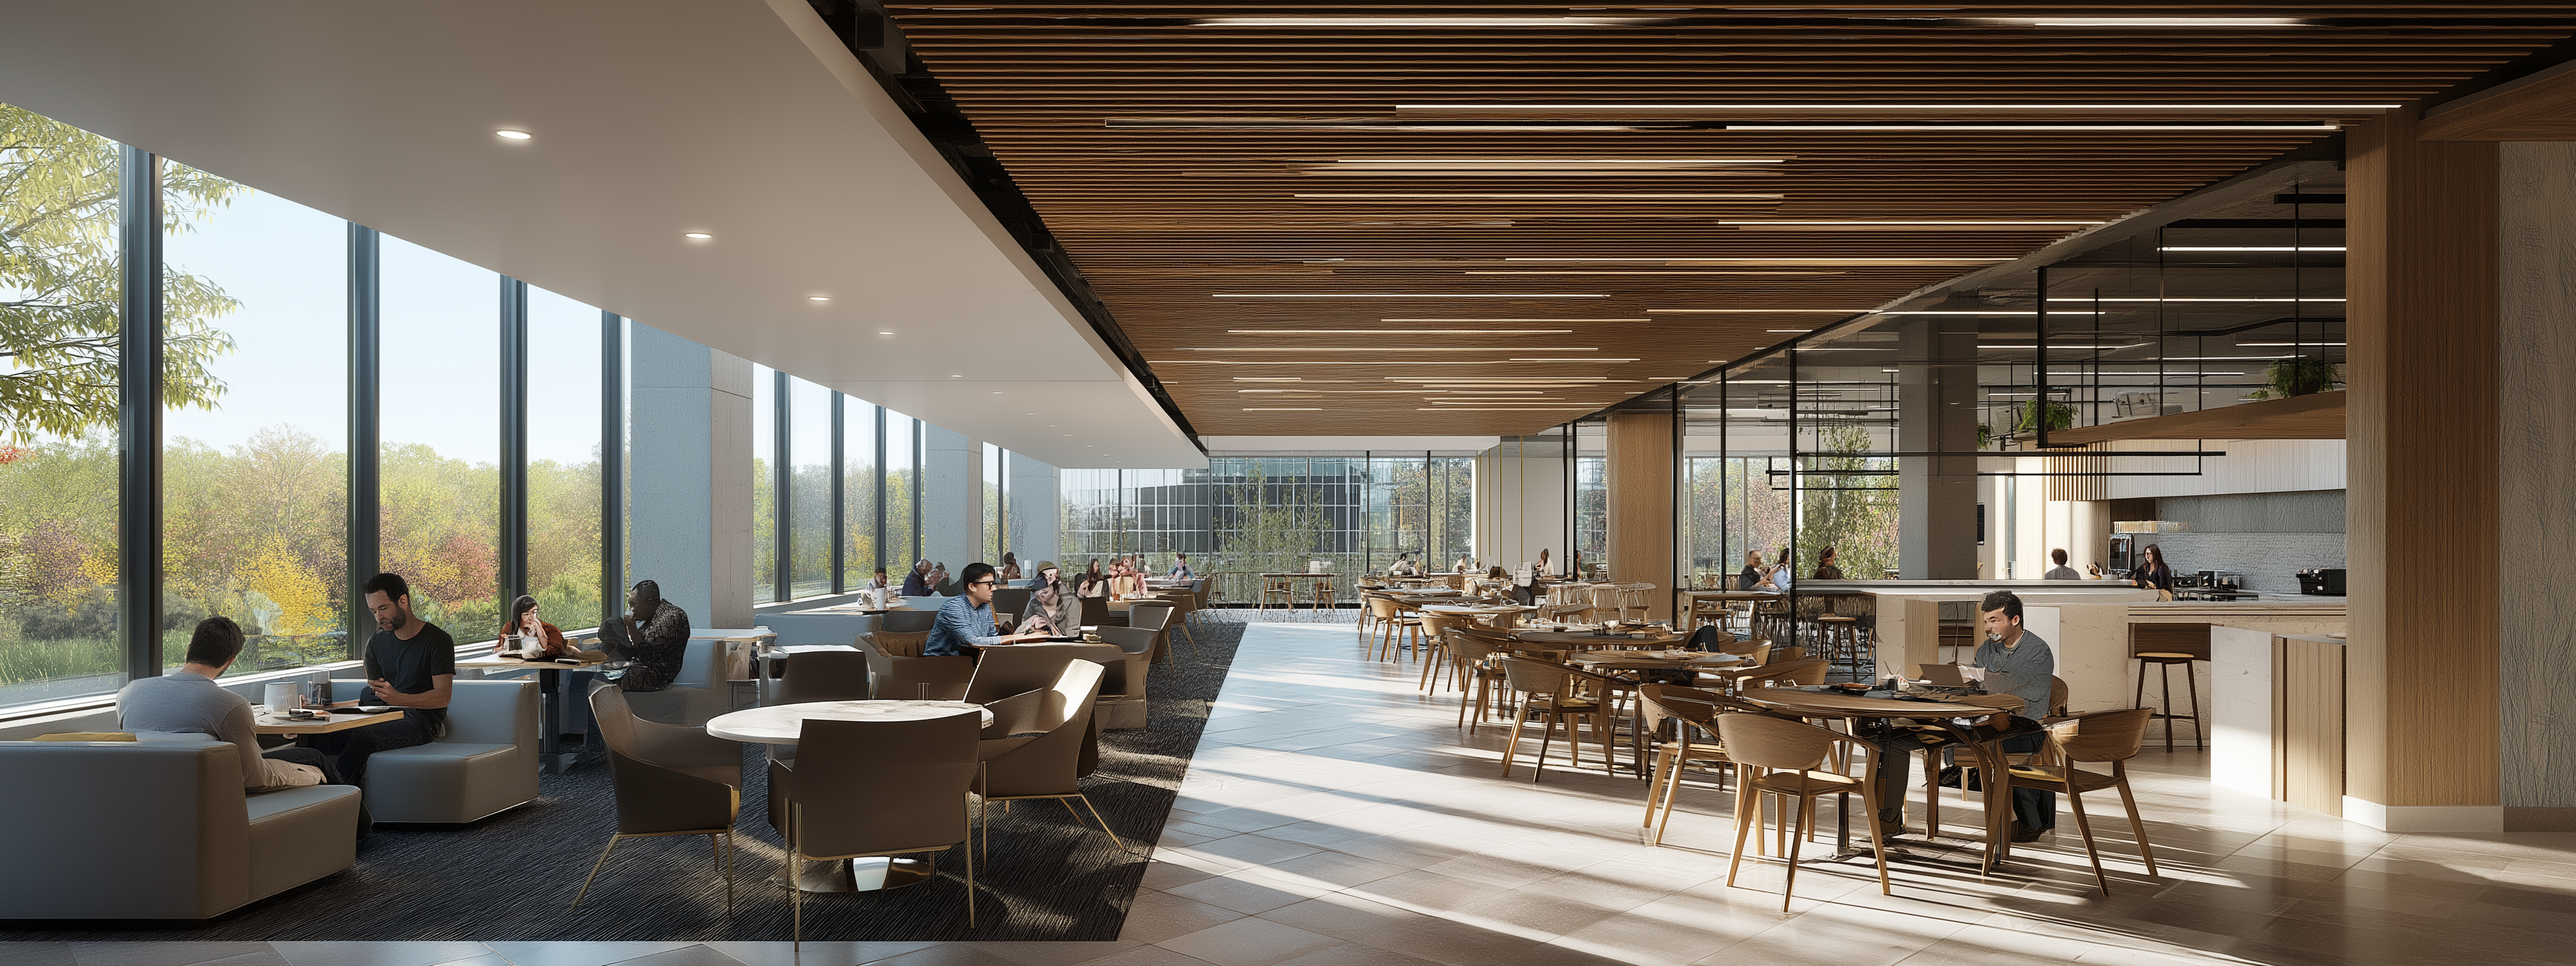
Redefining Office Occupancy: Moving Beyond the Numbers
Over the past year, workplace occupancy has begun to stabilize across global markets. According to Cushman & Wakefield’s What Occupiers Want 2025 report, average office occupancy now sits between 51–60%, with many organizations shifting from reactive downsizing to proactive portfolio management. Yet beneath this surface of stability lies a deeper challenge: how can Corporate Real ... Redefining Office Occupancy: Moving Beyond the Numbers

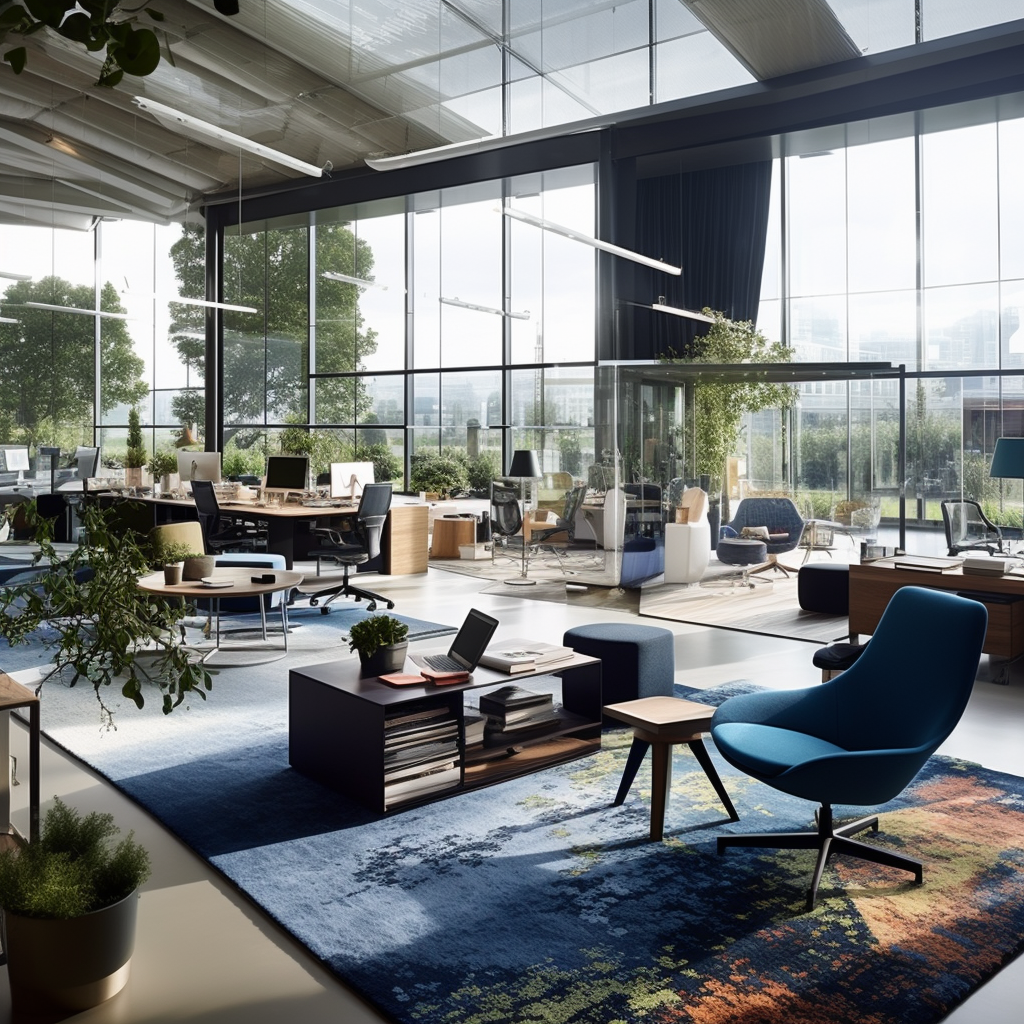
Uncharted New Landscape at Work
Embracing a Hybrid Work Landscape – The post-pandemic office “Without change there is no innovation, creativity, or incentive for improvement. Those who initiate change will have a better opportunity to manage the change that is inevitable.” – William Pollard. This wisdom resonates strongly today. As organizations gradually reintegrate into shared workspaces after pandemic disruptions, many ... Uncharted New Landscape at Work
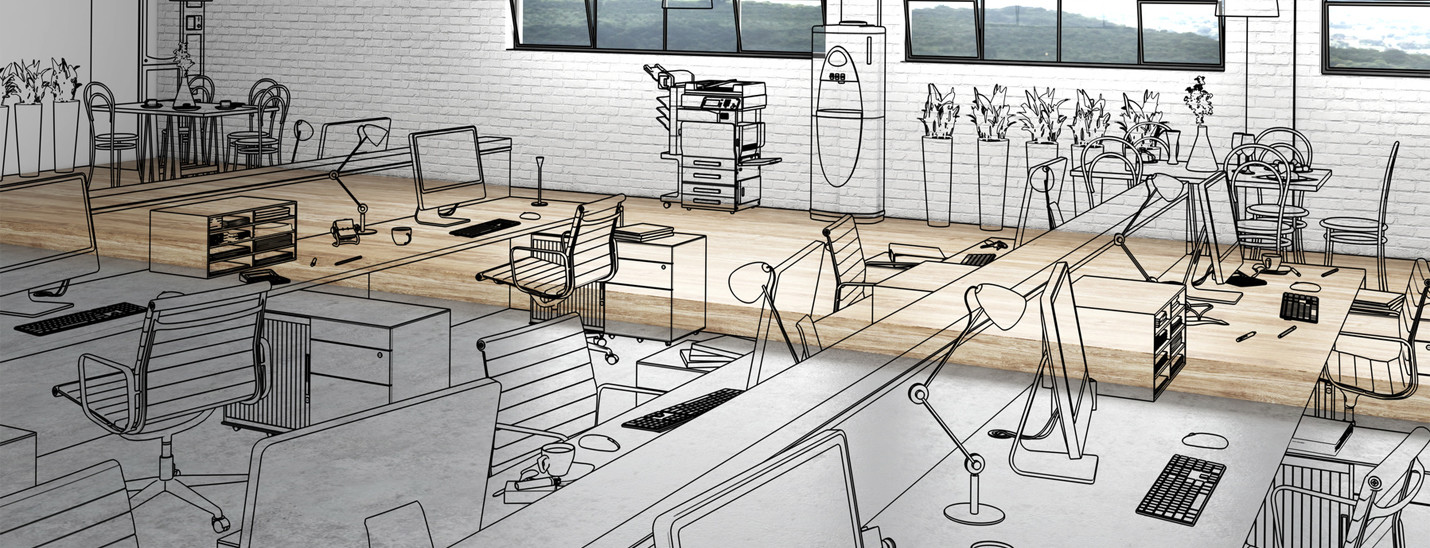
The Space Planner’s Best Friend
Boost Space Planning with Automated Utilization Data Our office space planning tool helps desk planners create efficient, hands-free workspaces from day one. With intuitive features and real-time insights, this tool makes designing and managing office layouts simple and stress-free Most workplace consultants that we interviewed revealed that their clients increasingly ask them to gather workplace ... The Space Planner’s Best Friend

What You Can’t See Without Workplace Analytics – Question 2/7
You walk into your office and see occupied desks, empty chairs, and maybe a few meeting rooms in use. But do you know which areas are used most, or why others sit empty? Without workplace analytics, you’re flying blind.In this second article of our 7 Questions You Can’t Answer Without Workplace Analytics series, we explore ... What You Can’t See Without Workplace Analytics – Question 2/7

What You Can’t See Without Workplace Analytics – Question 1/7
Workplace Analytics is about much more than simply counting people in a space or devices on the network. It’s about understanding how people use the resources available to them – and using that information to drive changes that enhance the employee experience and operational efficiency myseat.io. In this series of posts, we will explore seven ... What You Can’t See Without Workplace Analytics – Question 1/7

Workplace Utilization Data Compared to Google Mobility Report
MySeat combines real-time occupancy data with Google mobility reports for better workspace analytics. Compare foot traffic trends across sectors and optimize your workplace strategy.
Advantages of asset tracking in Healthcare
The main challenge of patient flow management is the unpredictability of events in a hospital (or healthcare) setting. Lack of information creates unnecessary wait times for patients and loss of time for healthcare personnel.
Space Utilization Case Study at Ubisoft Montreal
MySeat helped monitor 28 meeting rooms in LeEco's San Jose office, achieving a 5X reduction in IT complaints about room availability and reducing real estate needs by proving some rooms could be converted to workstations.

MySeat meeting room utilization data compared to room booking software
Companies are increasingly looking to reduce real estate costs, and the analytics tools to plan and execute the transformation of their workplace from a traditional allocated-seat-for-every-person-model to an alternative workplace strategy. These tools are vital to ensure that they provide sufficient resources for when their employee comes to the office.

Remote work versus Hybrid Workplaces: where do people wish to work
Over a year after the pandemic began, the question of remote work vs. hybrid work remains top-of-mind for employees and employers alike. How many days should people return to the office, if at all? A recent LinkedIn poll by marketer Sandra Parker drew over 108,713 responses, reflecting how widespread and urgent this discussion has become. ... Remote work versus Hybrid Workplaces: where do people wish to work
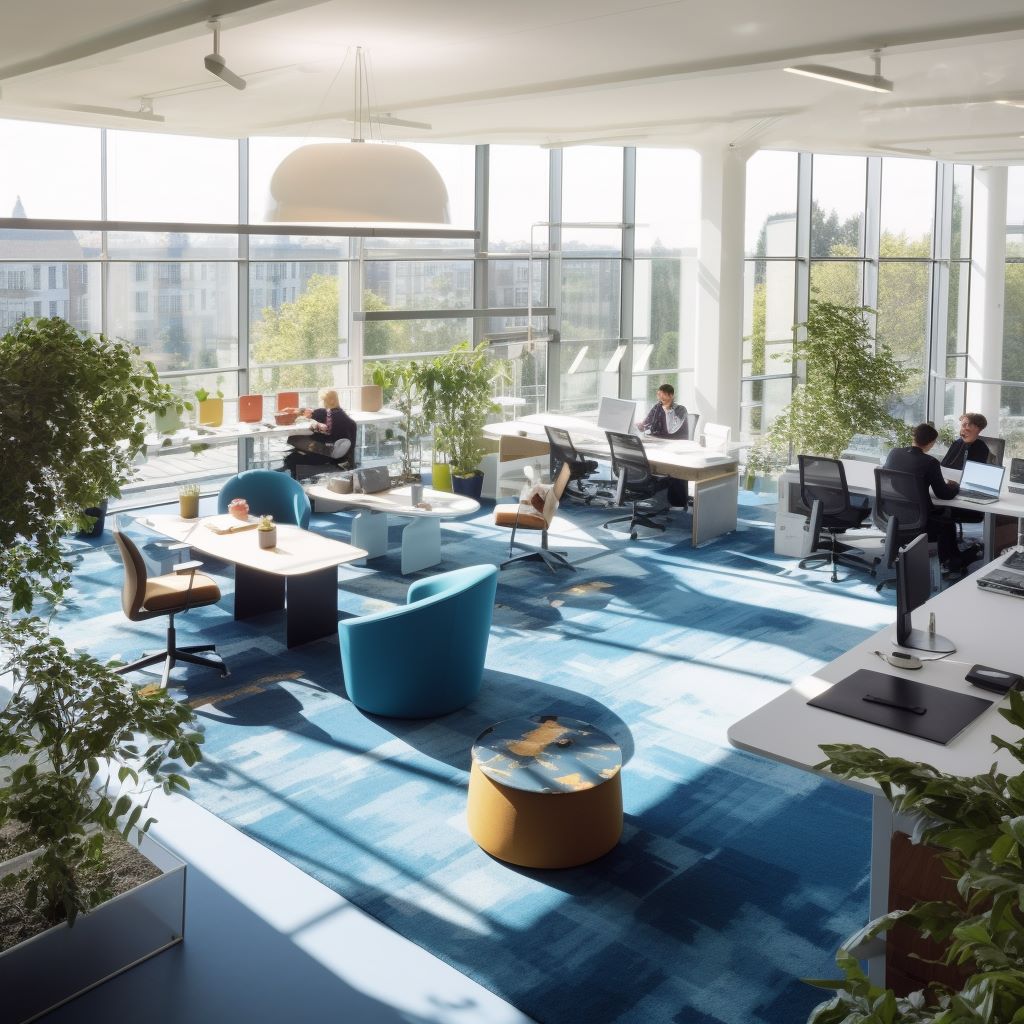
The Importance of Occupancy Data in Workplace Design
Data and the design of spaces Occupancy data provides valuable insight into how workspaces are used by employees. They can help organizations, and their designers, understand space usage trends. By using this data, organizations can tailor their work environments to meet employee needs, optimize space utilization and ultimately reduce costs and make places more efficient.
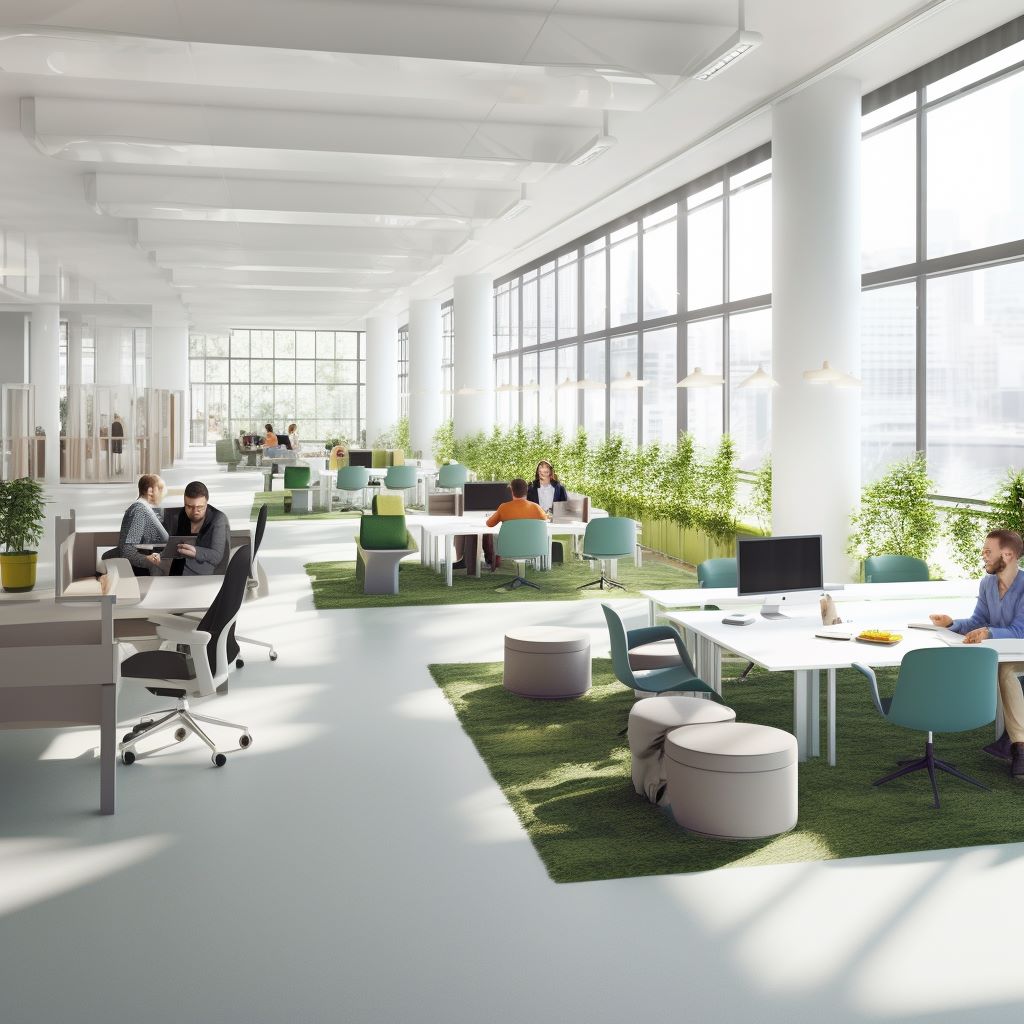
Enhance Workplace Efficiency with Data-Driven Office Space Audits
In today's fast-paced business landscape, optimizing office space is critical for improving employee productivity, collaboration, and overall workplace satisfaction. As a facility management team, space planner or workplace designer, making informed decisions about space utilization can lead to significant cost savings and create a conducive environment for success.
Office Space Analytics: A Sensor-Based Guide
A Simple Guide to Office Space Analytics with Accelerometric Sensors Are you looking to understand Office Space Analytics? Accelerometric sensors are the key. This guide will help you dive into the analytics of your office space usage
Guide to Office Space Analytics: Improve with MySeat
Guide to Conducting an Office Space Occupancy Analytics Study Understanding office space analytics is key to creating a productive and efficient workplace. In today’s data-driven world, companies can no longer rely on guesswork for space planning – they need concrete insights into how their workspaces are used. That’s where an occupancy analytics study comes in. ... Guide to Office Space Analytics: Improve with MySeat